Liquefied natural gas (LNG) has numerous uses in the transportation sector.
LNG is increasingly being used by the United States and countries around the world to fuel ships, bus fleets and trucks as we seek cleaner air by lowering our carbon and greenhouse gas emissions.
Experts predict a bright future for LNG as a transportation fuel. Below are some of the opportunities and issues surrounding LNG’s role as a fuel.
The International Maritime Organization mandated a cap on sulfur emissions from marine vessels to be implemented on Jan. 1, 2020. CLNG supports the implementation of IMO 2020.
In order to meet the new emissions standards, known as IMO 2020, many of the world’s shipping companies, builders and operators are turning to LNG because it is a cleaner alternative fuel that:
- Is safe, affordable and abundant
- Emits only trace amounts of the sulfur oxide that IMO has capped
- Reduces traditional pollutants such as NOx
- Reduces carbon emissions, which could enable shipping operators to meet potential carbon regulations in the future
Worldwide, the global fleet of LNG-powered ships is expected to grow to close to 1,800 vessels by 2020, according to DNV GL.
The links below provide more information about CLNG’s support for marine use of LNG:
- Real Clear Energy Op-Ed “American LNG Positioned to Win With IMO 2020” by Charlie Riedl
- LNG as a Marine Fuel- Our Zero Emissions Future Starts Now (Data Source SEA LNG)
- SEA-LNG (Global LNG trade association dedicated to LNG as a marine fuel)
“Bunkering” is the supplying of fuel to ships and includes the logistics of loading and storing fuel.
The proliferation of LNG-fueled ships requires investment in LNG bunkering operations at seaports. CLNG advocates for regulatory certainty, which is necessary to support a thriving investment environment for LNG bunkering infrastructure.
Bunkering operations are currently located at only a few U.S. seaports, but bunkering is expected to grow to more ports as more ships choose LNG as a fuel.
- U.S. LNG bunkering currently takes place at two locations – Jacksonville, Florida and Port Fourchon, Louisiana – with a third facility under development in Tacoma, Washington.
- Jacksonville is the largest LNG bunkering operation in the United States, with two bunkering facilities: JAX LNG, which is currently operational; and the upcoming Eagle LNG. JAX LNG continues to drive down emissions in the marine space through service agreements with foreign and domestic ships as well as offering renewable LNG offerings.
- At Port Fourchon, Harvey Gulf International Marine operates LNG bunkering to fuel its LNG fleet
- At Tacoma, Puget Sound Energy has proposed a liquefaction and bunkering facility to serve vessels operating along the journey between Washington and Alaska
LEARN MORE:
Compressed natural gas (CNG) and liquefied natural gas (LNG) are both used as vehicle fuels, however LNG is better suited for heavy-duty vehicles traveling long distances.
The expanded use of natural gas as a transportation fuel, whether in the form of LNG or CNG, can help reduce air pollution and carbon emissions from the transportation sector.
According to NGV America, the voice of the natural gas vehicle industry:
- On a well-to-wheel lifecycle basis, vehicles powered by natural gas emit between 13 and 21 percent fewer greenhouse gas emissions compared to gasoline and diesel-powered vehicles.
- Natural gas-powered vehicles can also improve local air quality as they emit approximately 80 percent fewer non-methane hydrocarbons and 50 less NOx gas.
Comparison of Environmental Footprint of Natural Gas
The National Energy Technology Laboratory (NETL) analyzed and compared the greenhouse gas (GHG) emissions of exported U.S. LNG over its full life cycle with the life cycle emissions of regional coal or gas used for electricity in European and Asian markets.
NETL’s life cycle analysis concluded that GHG emissions from U.S. LNG exports for power production in European and Asian markets compare favorably to the use of regional coal.
- In Europe, the global warming potential* (GWP) of power generated from:
- Imports of U.S. LNG — GWP is 23%-56% less than regional coal over the full life cycle.
- Pipeline natural gas from neighboring country– GWP is 20%-53% less than regional coal over the full life cycle.
- In Asia, the GWP of power generated from:
- Imports of U.S. LNG — GWP is 14%-49% less than regional coal over the full life cycle.
- Pipeline natural gas from neighboring country — GWP is 14%-49% less than regional coal over the full lifecycle.
* GWP measured over standard 100-year period.
GHG Emissions from Imported U.S. LNG Compare Favorably to Regional Coal & Natural Gas in Europe and Asia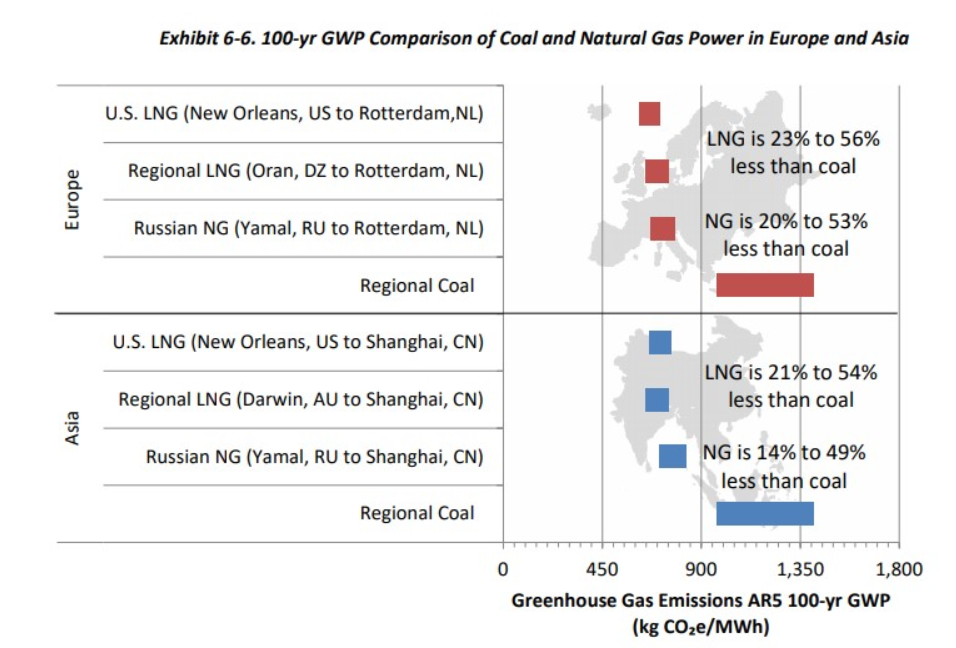
Source: Life Cycle GHG Perspective on Exporting Liquefied Natural Gas from the United States: 2019 Update, Exhibit 6-6 “100-yr GWP Comparison of Coal and Natural Gas Power in Europe and Asia”