Natural gas, like other energy sources, has an impact on the environment.
That impact has been largely positive over the last two decades, as greater use of natural gas and LNG have contributed to reduced carbon emissions and provided reliable support and back-up for renewable energy.
Although the use of LNG has been instrumental in lowered emissions and improved air quality, natural gas does have an environmental footprint, including methane emissions and carbon emissions. This page explores policy issues associated with the environmental footprint of liquefied natural gas.
- CLNG advocates for rules and policies that protect the environment while allowing consumers continued access to LNG and its environmental and economic benefits.
- CLNG remains committed to the goals of the Paris Accords and COP27.
Natural gas has played a significant role in reducing CO2 emissions from the U.S. power sector to 25-year lows because of its relatively low carbon content and because of its role as an integral partner to renewables. CLNG members believe that those same benefits can be spread globally through competitive LNG markets.
- Chart: Reaching Climate Goals with Natural Gas & LNG (Fall 2021)
- Study: National Energy Technology Lab: Lifecycle Greenhouse Gas Perspective on U.S. LNG Exports This 2019 update of DOE’s analysis of emissions from U.S. LNG exports analyzes greenhouse gases emitted through the entire lifecycle of LNG exports from the United States
- Chart: Increased Use of Natural Gas Drives CO2 Savings in 2005-2018 (Data source: U.S. Energy Information Administration Monthly Energy Review, 2020)
- Chart: U.S. Leads the World in Carbon Reductions 2005-2017 (Data Source: U.S. Energy Information Administration)
- Study: Market Forces Driving Increased Use of Natural Gas, Cleanhttps://www.lngfacts.org/pdf_download/microsoft-word-ngc-final-report-1/er Energy Mix — Pace Global Report on Natural Gas and Low Carbon Energy Future, (April 20, 2017)
- Study: Finding the Facts on Methane Emissions: A Guide to the Literature (April 2016)
NEPA is a fundamental tool to ensure the appropriate protection of the environment in federal regulations, mandating that federal agencies consider environmental impacts of their proposed actions.
The Center for LNG advocates for clear timelines and a clearly-defined scope for the effective implementation of NEPA by federal agencies, states and tribes so that needed infrastructure for economic growth can proceed with greater regulatory certainty and environmental protections.
- NGSA and Center for LNG Joint Statement on Modernization of NEPA (July 15, 2020)
- NGSA and Center for LNG Comments on Proposed Modernization of NEPA Guidelines (March 10, 2020)
- NGSA and Center for LNG Joint Statement on Proposed Modernization of NEPA Guidelines(Jan. 9, 2020)
- NGSA and Center for LNG Joint Statement on CEQ’s Draft NEPA Guidance(June 21, 2019)
- NGSA-CLNG Comments on CEQ Proposal to Update NEPA Regulations(Aug. 20, 2018)
- NGSA and Center for LNG Joint Statement on White House Rescinding CEQ NEPA Guidance(March 28, 2017)
Comparison of Environmental Footprint of U.S. LNG to Regional Fuels
The National Energy Technology Laboratory (NETL) analyzed and compared the greenhouse gas (GHG) emissions of exported U.S. LNG over its full life cycle with the life cycle emissions of regional coal or gas used for electricity in European and Asian markets.
NETL’s life cycle analysis concluded that GHG emissions from U.S. LNG exports for power production in European and Asian markets compare favorably to the use of regional coal.
- In Europe, the global warming potential* (GWP) of power generated from:
- Imports of U.S. LNG — GWP is 23%-56% less than regional coal over the full life cycle.
- Pipeline natural gas from neighboring country– GWP is 20%-53% less than regional coal over the full life cycle.
- In Asia, the GWP of power generated from:
- Imports of U.S. LNG — GWP is 14%-49% less than regional coal over the full life cycle.
- Pipeline natural gas from neighboring country — GWP is 14%-49% less than regional coal over the full lifecycle.
* GWP measured over standard 100-year period.
GHG Emissions from Imported U.S. LNG Compare Favorably to Regional Coal & Natural Gas in Europe and Asia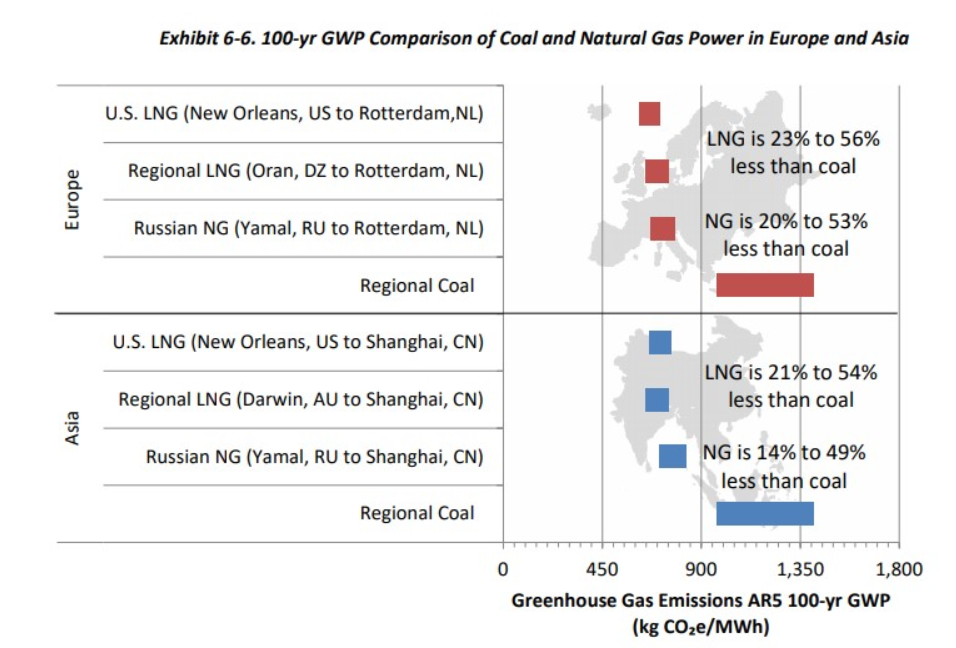
Source: Life Cycle GHG Perspective on Exporting Liquefied Natural Gas from the United States: 2019 Update, Exhibit 6-6 “100-yr GWP Comparison of Coal and Natural Gas Power in Europe and Asia”